In this Project, I created new datasets, imported datasets and carried out Correlation Analysis using a Heatmap, Sort and filter operations, Created a dashboard with 6 visuals to derive insights from my data
using the Matplotlib, Seaborn, and Plotly libraries, Carried out Descriptive Statistics on the dataset, Created a linear and logistic regression model to make predictions on one of the
dataset.

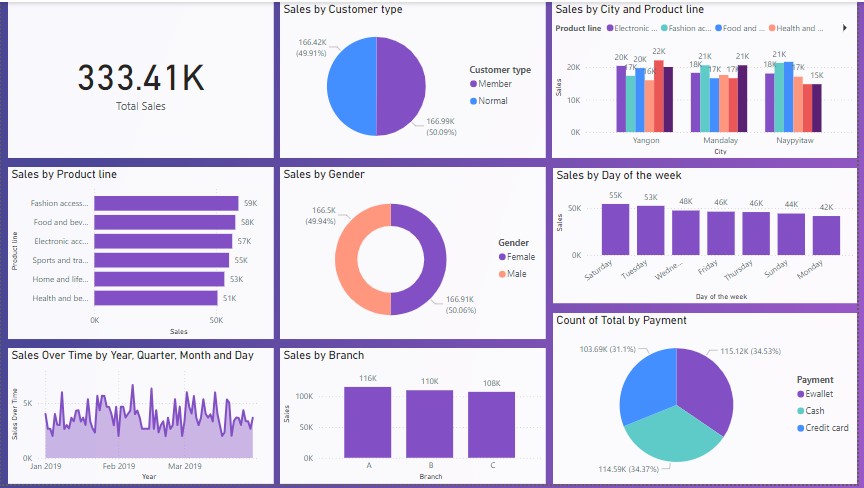
This dashboard highlights customer segmentation, product performance, and sales trends. Key recommendations include enhancing loyalty programs, boosting underperforming product lines, optimizing sales on weekdays, and tailoring strategies by branch and city for targeted growth.
In this project, I conducted a comprehensive analysis of COVID-19 data, focusing on global trends and key metrics such as daily case counts, death rates, and vaccination progress.
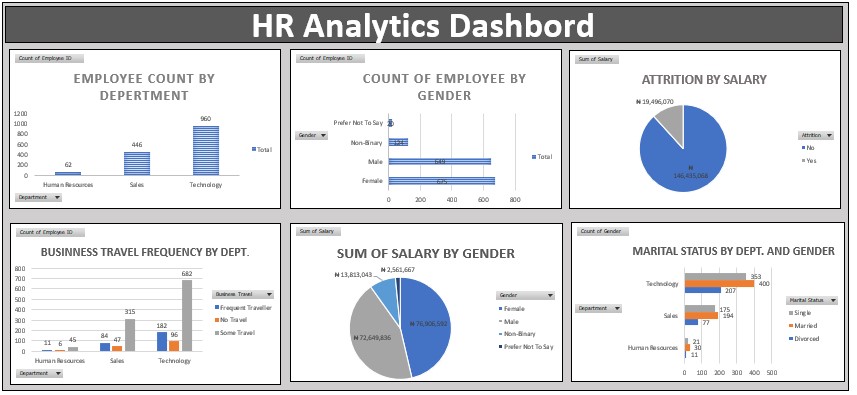
An HR Attrition Project providing insights into employee distribution by department, gender, and salary. It also highlights attrition rates, business travel frequency, and salary breakdowns by gender. This dashboard helps HR teams identify trends in employee turnover and make data-driven decisions for retention and workforce planning.